Quick answer
In 2026, grid instability has hit countries at every income level and every stage of energy development. Nigeria's national grid collapsed three times in a single month. Pakistan's power shortfall reached 6,500MW at peak demand. South Africa recorded almost 92,000 unplanned outages despite officially ending load shedding. Lebanon's state utility can supply only 4–5 hours of electricity a day against 3,000MW of demand. Even Britain came within minutes of a blackout during a summer heatwave. The common thread, according to the International Energy Agency, is that global electricity demand is now growing roughly 50% faster than the previous decade's average — faster than most grids are being reinforced to handle. Here's what the numbers actually show, country by country.
Power outage headlines tend to arrive as isolated stories — a grid collapse here, a load-shedding schedule there. Looked at individually, each one reads as a local problem with local causes. Looked at together, across a single year, a clearer and more useful picture emerges. This is that picture, built from verified data rather than anecdote.
Nigeria: Three Grid Collapses in a Month
Nigeria's national grid — which serves over 200 million people — collapsed three separate times within roughly a month: 29 December 2025, 23 January 2026, and 27 January 2026. A "grid collapse" in Nigeria's context means the entire national transmission system loses synchronisation and shuts down, not a localised outage — every collapse requires a full, staged restart of generation and transmission infrastructure, typically taking hours to fully restore.
The underlying causes are structural rather than one-off: a gas supply crisis limiting fuel to gas-fired power stations, which supply the majority of Nigeria's generation, combined with ageing transmission infrastructure that has struggled to keep pace with demand growth for years.
Pakistan: A 6,500MW Shortfall and a Debt Spiral
Pakistan's electricity shortfall reached approximately 6,500MW during peak demand in 2026 — a gap between what the grid needs to supply and what it can actually generate and deliver. But the more revealing numbers sit underneath that headline figure.
Transmission and distribution losses run at roughly 17–18% nationally, meaning close to a fifth of generated electricity never reaches paying customers. That loss feeds directly into "circular debt" — the gap between what distribution companies bill and what they actually collect — which limits how much fuel generation companies can buy, which in turn limits how much power can be produced even when demand is high. This is documented in detail in NEPRA's own State of Industry Report, the regulator's annual public accounting of exactly where the sector is losing money and power.
The practical result for businesses is what we covered in our dedicated guide to Pakistan's unannounced power cuts: revenue-based load shedding ties outage length directly to an area's bill-collection rate, meaning some feeders face cuts of up to 18 hours while others see comparatively little disruption — a pattern with almost no advance warning for the businesses affected.
South Africa: The Crisis That "Ended" but Didn't
South Africa's numbers tell one of the more counterintuitive stories in this report. On 16 May 2026, Eskom marked 365 consecutive days without load shedding — a genuine, hard-won achievement after years of scheduled national blackouts. Yet in the same period, data from energy company Wetility recorded 91,934 unplanned grid outages across the country, averaging six to nine unplanned outages per household connection point every month.
The explanation is structural: Eskom's generation fleet has stabilised, but local distribution infrastructure — run by financially strained municipalities collectively owing Eskom close to R95 billion — hasn't kept pace. We go deeper into what's actually driving these unplanned outages, and what it means for business continuity planning, in our full South Africa power report.
Lebanon: A Country Running on Generators
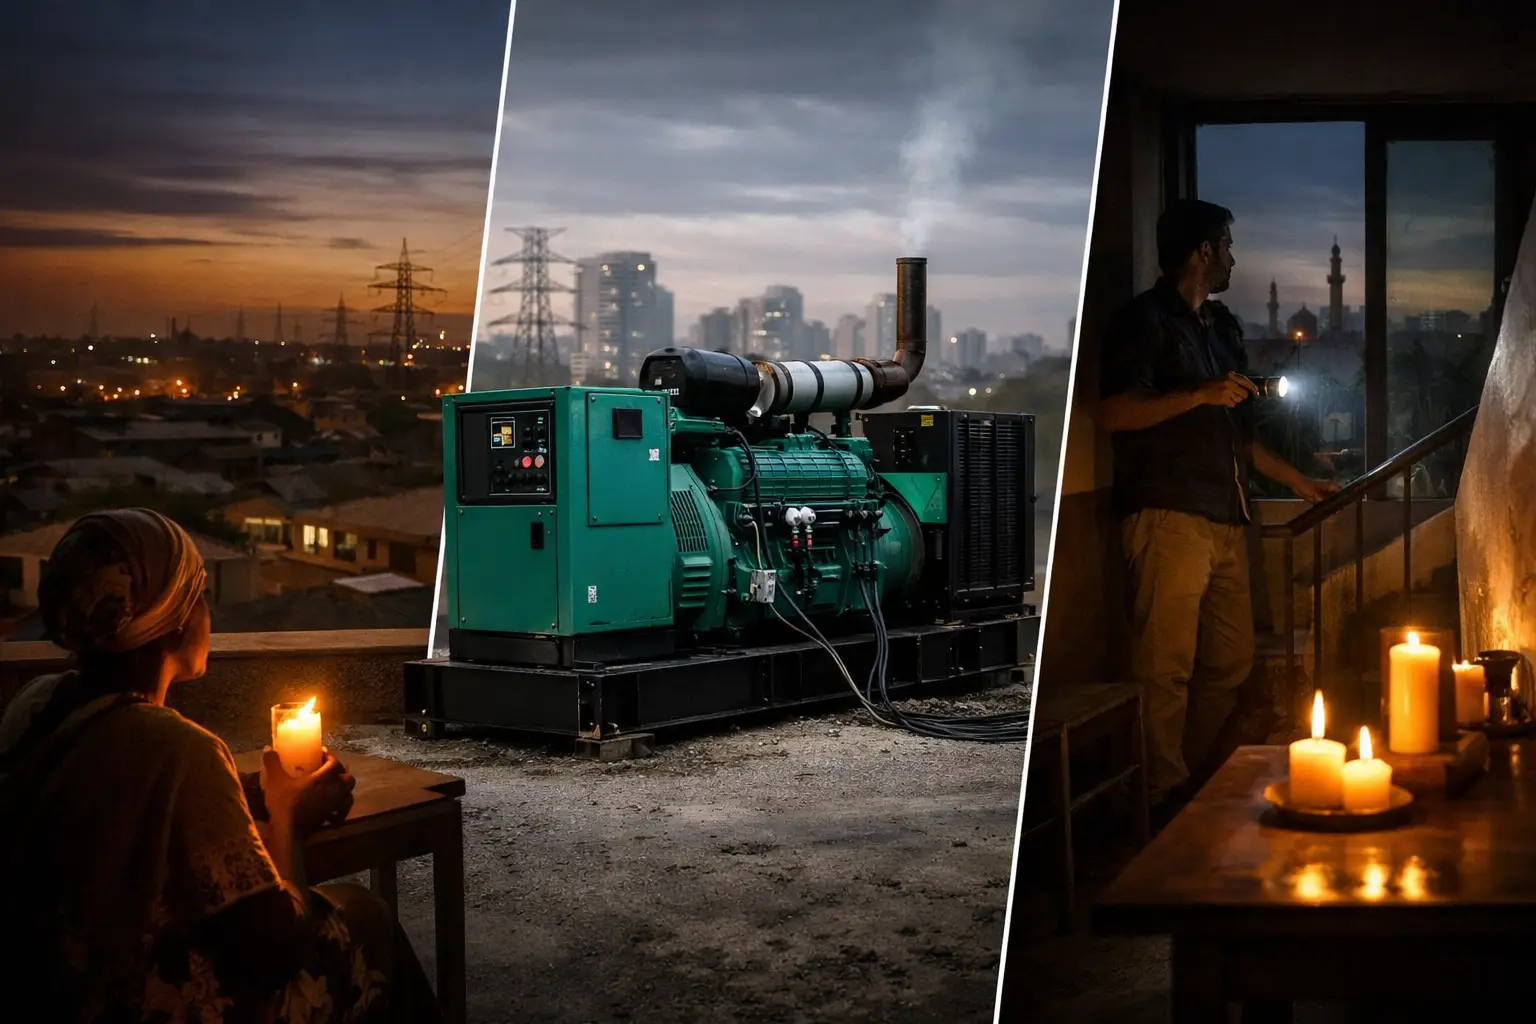
Lebanon offers the most severe numbers in this report, and a useful contrast to the other cases. Électricité du Liban, the state utility, currently produces around 500 megawatts of electricity — enough to supply roughly 4–5 hours of power a day — against national demand of approximately 3,000 megawatts. The shortfall isn't a periodic crisis; it's the baseline. For most of the country, private diesel generators aren't a backup plan — they're the primary source of electricity, filling a gap the state grid simply cannot close given its current fuel supply and financial constraints.
Lebanon is the clearest illustration in this report of what happens at the far end of grid instability: when outages become permanent rather than occasional, backup power stops being insurance and becomes core infrastructure.
Britain: A Reminder That Developed Grids Aren't Immune
Not every entry in this report comes from a country typically associated with grid instability. On 23 June 2026, during a heatwave and a World Cup match, Britain's grid frequency dropped to its lowest point of the year, and National Energy System Operator (Neso) had to call French grid operators for emergency power to avoid a blackout. Roughly a fifth of the country's generating capacity was offline that day, wind underperformed forecasts, and one of the interconnector cables that would normally provide backup capacity was itself offline.
No blackout occurred. But the episode is a useful data point precisely because it happened in a grid widely considered stable and well-resourced — proof that thin margins are a global phenomenon, not a symptom confined to lower-income grids.
The Global Number Behind All of These: 3.6%
Individually, each of these stories has its own specific cause — a gas crisis, circular debt, municipal underinvestment, fuel scarcity, a heatwave. But the International Energy Agency's Electricity 2026 report puts a single number behind the shared pressure sitting underneath all of them: global electricity demand is forecast to grow by an average of 3.6% a year through 2030, roughly 50% faster than the previous decade's average pace, driven by electrification, data centres, and rising cooling demand.
Grid investment isn't keeping pace with that growth. The IEA estimates more than 2,500 gigawatts of renewable, storage, and large-load projects are currently stuck waiting to connect to grids worldwide, and calls for global grid investment to rise by around 50% by 2030 just to avoid falling further behind. We explored what this means in more depth, including a practical framework for assessing your own exposure, in Is Your Country Next? The Growing Global Problem of Grid Instability.
What the Numbers Add Up To
| Country | Headline 2026 Figure | What It Actually Means |
|---|---|---|
| Nigeria | 3 grid collapses in ~1 month | Full national transmission shutdowns, hours-long restarts |
| Pakistan | 6,500MW peak shortfall | Up to 18-hour unannounced cuts in worst-affected areas |
| South Africa | 91,934 unplanned outages/year | Load shedding ended, but local outages didn’t |
| Lebanon | 4–5 hrs of state power/day | Generators are primary power, not backup |
| Britain | Lowest grid frequency of the year | Near-miss shows even stable grids carry real risk |
| Global | +3.6% demand growth/year | Demand outpacing grid investment worldwide |
Why These Numbers Keep Climbing, Not Falling
It's worth being clear about what these figures don't show. This isn't primarily a story about incompetence or mismanagement, even though poor governance plays a real role in several of these cases. It's a story about a global energy transition happening faster than the infrastructure built to support it. Electrification of heating and transport, the rapid build-out of data centres and AI computing capacity, and rising cooling demand as summers get hotter are all adding load to grids that, in most countries, were designed decades ago for a slower-growing, less electrified world.
That's why a genuinely well-run utility like Eskom can end an eight-year load-shedding crisis and still preside over 92,000 unplanned outages, and why a system as resourced as Britain's can come within minutes of failure on an otherwise unremarkable summer evening. The problem isn't confined to countries with weak institutions — it's a capacity and investment gap that shows up differently depending on how much financial and structural slack a given grid has to absorb it.
The Bottom Line
These aren't six unrelated national stories. They're six data points on the same underlying trend: electricity demand is climbing faster than grid infrastructure is being reinforced to handle it, in wealthy countries and developing ones alike. The specific numbers differ enormously — a near-miss measured in minutes in Britain, a permanent shortfall measured in daily hours in Lebanon — but the direction is consistent everywhere in this report.
For businesses, the practical takeaway isn't which country's numbers are worst. It's that a properly sized standby generator with automatic switching is no longer a response to one country's specific crisis — it's a reasonable baseline for operating in a global electricity environment where thin margins have become the norm, not the exception. The countries in this report simply show, in numbers, what that margin looks like when it runs out.